Looking for something? Search my blog here!

About Me

My photo
I was born in Mesa and lived in both Arizona and Utah. I attended four different high schools and moved back to Mesa my senior year. I love to travel and explore; I studied abroad in England, Scotland and France and had a blast. Music and writing drive me. I am a hard worker, when I am motivated to be. I am a passionate girl who loves people. I love friends but I also love my quiet time. Most importantly, I love to Love. I am a writer, an educator, a learner, an explorer and yes, a Mormon. I am blessed and I love my life. I am currently serving a mission for the Lord through the Church of Jesus Christ of Latter-day Saints in Italy until January of 2016.

My motto

My Motto
Love and Be Loved

Tuesday, April 29, 2014

Happy Day

Just as I think that my dreams will go flat, just as I'm on my breaking point, just as I slack and am about to give up and think my dreams and goals might not really happen... I get this friendly little reminder that yes, I make a difference, and Heather, that difference doesn't go unnoticed. Someone 
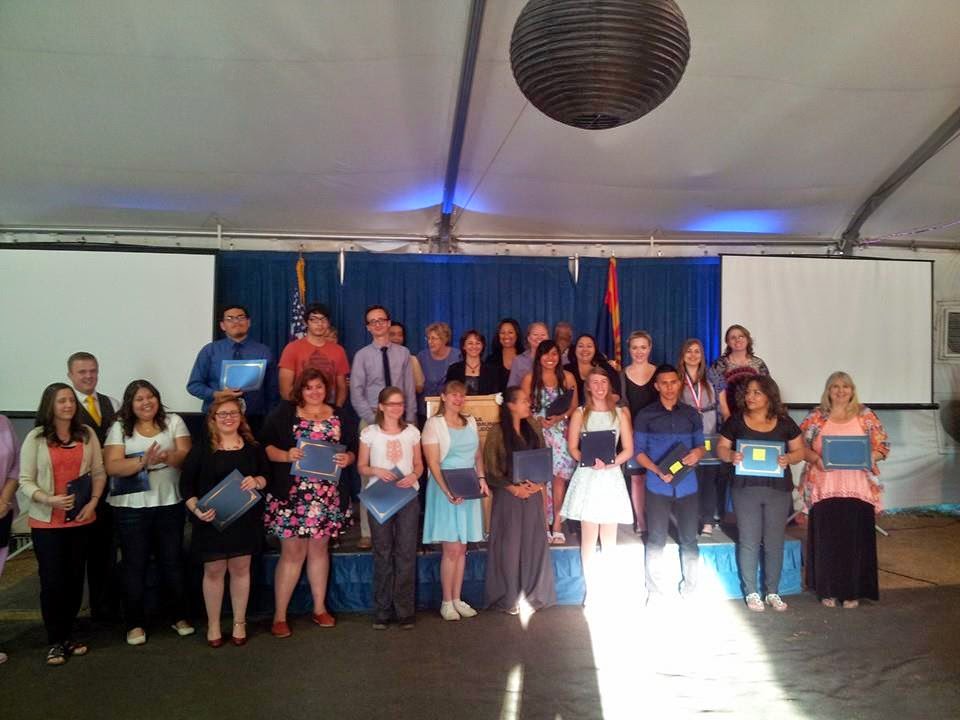
really does see me! I got the invite a while back to the award program tonight and was told it was for Excellence in my Education Studies. I didn't find out what it was for until I received it tonight, and I was pleasantly surprised and grateful.

Homework is not always fun. Papers are usually not easy to write. School is difficult. Teaching is very difficult. There is never enough time in a day, a week, a month, a semester- it always flies right on by. But you know what? I Love to learn and I Love to teach! This life is all about learning and I want those around me to gain knowledge of the very best they can. I just cannot stress how important our knowledge we learn now will be to us later (think of the eternal perspective...)

Whatever principle of intelligence we attain unto in this life, it will rise with us in the resurrection. And if a person gains more knowledge and intelligence in this life through his diligence and obedience than another, he will have so much the advantage in the world to come.” -Doctrine and Covenants Section 130

I am grateful for my advisers, faculty and professors at MCC. Seriously, attending a community college has been the greatest thing for me! Opportunities to get involved, make friends, travel, learn, grow, expand my diversity, be awesome. Community colleges are intimate and personal. There are SO many opportunities and I would recommend Mesa Community College to anyone. It's a love/hate relationship at most times, but overall I have Loved it. Nothing could have better prepared for me for a university than MCC. Did I mention how much cheaper it is? Did I mention you can get scholarships (easy) and go to school with money in your pocket? Then earn even more scholarships to later transfer to a university? Well I wasn't planning on making this spiel, but there you have it.

MY POINT OF THIS POST is that I am grateful for my life! I am grateful to be a part of the Gospel of Jesus Christ. I am so excited to serve Him for 18 months. I am excited to be a teacher. I Love my family, I love my friends, I Love me! I am blessed to live in America, even Arizona. Challenge: Wake up tomorrow and think, what is good in my life today? Yesterday? In the future? Dwell on that goodness! Give thanks. Give love. You are YOU and you don't need what anybody else has. In my opinion, from my beliefs, if we all follow God's path and try to be more like our savior Jesus Christ, than we can be happy and appreciate even the worst of storms. Look at the world around you: good or bad, God has a plan for it. Life is amazing. Make the most of what you have now.

Tuesday, March 11, 2014

Writing

To write is to form meaning on the surface of some material with an instrument or means.

A writer sits in her chair, setting words upon paper, spreading the seeds of idea.
(from a shop sign)

"To write is to write is to write is to write is to write is to write is to write is to write."
(Gertrude Stein)

To write: is to let go of everything you carry on your shoulders, hold in the palm of your hand, to rid of your worry and release the thoughts of your heart from where you stand...and to inspire.
(yours truly)

Sunday, February 23, 2014

Elementary Math post six: Mr. Mean and Friends

The mean is the average of a set of numbers. It is a general number that equals out all of the other numbers. To find it, you add all of the numbers together and divide that by the total number of numbers.
The standard deviation is a measure of how spread out numbers are.
The median is the number in the center of data numbers when ordered form least to greatest. If the amount of numbers in the data is even, then you add the two numbers together to get the average and that is the median.
The mode is the number that appears most often within a data set.
The range is simply the scale of how many numbers you are working with. Subtract the smallest number from the largest number.

We learned about these concepts in my math class. They are pretty useful when working with statistics and numbers. They may sound scary, but really they aren't. They are practical and very useful, especially as a teacher. Below I am just going to give a data set and an example of each of the five answers. All can be found on a TI graphing calculator so if you are a teacher, I would recommend looking into that.

Example

The following scores are what students in the class earned on their test: 71, 98, 93, 42, 78, 82, 100, 91, 83, 85, 71, 73, 64, 68, and 55.
The mean is 76.93
The standard deviation is 16.02
The median is 78.
The mode is 71.
The range is 58.

A Great explanation

Wednesday, February 19, 2014

The Homework Stop

I long for the day when I won't have to do homework I hate, do busy work, do what somebody else cares about when I don't care squat... all just to work towards getting that wondrous letter "A" stamped on my record. I love homework that I actually enjoy, where I learn something and it has meaning in my life. I can't wait to have time to be me and share what I am most passionate about with others. To help others find their place in life.

I pray and try everyday to be a difference in someones life and help them to be happy. If you aren't happy in you heart, than who are you? I want to write. I have these thoughts in my head that get lost because I do so much stupid homework for that one class that I didn't want to take, but was required. Sure, I still learn a lot from it. But clearly the homework is not doing it's duty- no matter how awesome a teacher you are. I want to teach to share my love and knowledge with others to help them grow and understand the world.
I hate sitting in classrooms through lectures. Why not build open walls? School is so very terribly mentally exhausting. It makes you lazy and super productive all at once. I go to bed and my eyeballs ache. You don't have time to eat. Working out asks for energy that you (don't think) you have. When do I write? When do I read? When do I go on long bike rides?

OK, I'm being silly... only kind of. Am I right? Does anyone else feel like this? Of course I still do the things I want but I always feel like I'm doing them guiltily, knowing I have homework I could do instead.
Anyways. That's my rant. Now maybe I can focus on this busy-work homework that I am hating so very much. I could have been 1/5 of the way done by now. But at least I got that off of my mind.
Blahhhh...

Thursday, February 13, 2014

Elementary Math post five: Graphs, Charts and Tools Galore

In class we talked about different types of charts and graphs that a person could use. I have mentioned them in italics already in previous posts, but here I want to share more about some of them.

Bar Graph
Bar graphs are easy to read, show clear information and are great for displaying categorical data, or common data that falls into categories.


Source
Histogram
A histogram is very similar to a bar graph, the only difference is that the bars touch each other because it is showing two or multiple groups of data.


Source


The Pictograph
A pictograph is what we used for the m&m's previously. They are continuous and appear to be easy to read, but it is difficult to see exactly how many of something it is displaying.


Source
Pie Chart/ Circle Graph
Pie charts are super easy to compare your data with. You can look at one immediately and see, for example, that there are more penguins than llamas. They are not very easy to make by hand, but they are very precise. They also use categorical data.


Source
Line Graph
Line graphs are quite simple and very common. They typically show trends over time and are continuous, with numerical data, meaning they show numbers of something. The dots are the where the data is found and the lines simply connect the dots to show whether the trend is positive, negative or neutral.


Source


Dot Plot
This type of graph might be my favorite. They are easy to read and can be great to use with large portions of data. This is what we used as a class for the m&m's. They can show areas of clusters where numbers are grouped together and visually display how many are connected to each number. They don't show specifics, but in general it is a good graph to use.


Source

Graphs and pactice

Tuesday, February 11, 2014

Elementary Math post four: Mmm M&M's

In almost every class I think, man, this class sure would be better with food. Guess what? My wish came true! We did an experiment for data analysis and statistics using a small sample of regular m&m's and got to eat them afterwards. Score.

Before we began, there were two questions asking which color we think would occur most often, least often and why. I said blue would occur most because it's the color we all love, and brown would occur least because it's the ugly, boring color. Well we grabbed our sample and recorded how many m&m's of each color we had individually. Then we placed the m&m's on this pictograph and colored in the circles (notice how I did mine backwards, because I got so excited that I wasn't paying attention.) Next we added all of our class data together to find out if our predictions were accurate or not. Go back to post one where I describe Bernoulli's theorem. By putting all of our data together, it was really interesting to see what the results were. We then made a class dot plot and on our own we made both a pictograph and a bar graph with the class data. 
Experiments like this one are a really great way to get students interested in the topic they are learning. It is a great discovery method and gets them thinking about stuff in the world like, how do they choose how many colors to put in m&m's or how do retailers know how many clothing sizes to buy for each size? In addition to great learning, activities like this one are FUN and kids will love it.

The class results
Brown: 61 or 15%
Green: 79 or 19%
Orange: 88 or 22%
Red: 56 or 14%
Blue: 78 or 19%
Yellow: 45 or 11%

Thursday, February 6, 2014

Elementary Math post three: Acing the Test

On my last post for math, I titled it "Probability Pains.'' That was because I was getting really frustrated with all of the numbers flying around. The odds of getting an ace in a deck of cards vs. the probability of getting an ace in a deck of cards. The ideas really are rather simple, but for some reason I had such a hard time understanding all of it! How would I have ever come out on top on my test?

As I'm sure every other student is like, I wanted to do really well on my first test. This is my second semester having my awesome teacher so I knew what to expect: explanation for every problem. (Remember, it's math for the elementary teacher.) Coincidentally (and I don't recommend this first part) I saved two math assignments to do right before class. So I said a prayer and I decided I would go sit in the Math Tutoring Center so that I could ask for sufficient help when I needed it. Let me just say that was the best decision I have ever made. Why had I never used that place before? There were three problems I was confused about and didn't quite understand, and there was one in particular that had been troubling me since day one. So I asked for help, a sometimes (not so) easy thing to do. And guess what? Two of those exact problems with different numbers were on the test. 
And I ACED that test!!! During both semesters I have never gotten a grade higher than, well, this high! A happy 98%. I am thrilled. So it was a bad idea to save my homework for the last minute. But let me tell you that there's probably a reason you are stuck on a certain problem. So ask for help. Seek for understanding and figure it out. It's that simple, really. I hope to get better at asking for help myself because, as this test proved, it pays off.

Just a lil' bit of help for you Click on Tips For Success ECE102.doc It is a download.

Wednesday, February 5, 2014

The cheesecake challenge

I love me some creamy, cold, delicious desserts. Fresh fruit smoothies, vanilla bean ice cream with a drizzle of fudge sauce, Bahama Bucks' shaved ice, chocolatey brownies, and most especially, cheesecake. Mmm.

Living in our world today, goodies such as the ones I listed above are not necessarily "nutritious" for us to eat all the time. Well, I'm a person small in size and gaining weight is not particularly one of my concerns for now. However, I do notice a difference in my body when I eat said deliciousness on a regular basis (which let's face it, is pretty regular.)

But wait! Just because all of that sugar and fat is bad for our bodies, doesn't mean we must eliminate the flavor. So here's my secret. Really I'm just backing up what the commercials say. Have you heard of Yoplait? Yes, it's a yogurt. Yes, that's my secret. My new junk food plan.

It all started when I was buying some yogurt one day. I always eat fruit and carbs and protein for breakfast, and I like yogurt when I don't use milk. I started buying the strawberry cheesecake flavored yogurt and I loved it. One night, I was hungry before bed. I wanted some ice cream or some sort of yummy treat. I love cheesecake! It could be my weakness (along with anything ice cream or fruity). So what did I do? Instead of having a bowl of ice cream, I reached in the fridge and had some yogurt. Mmm. Best decision I ever made, because I have officially made it my new night time snack. Cheesecake taste: check. Craving satisfied: check. As this video shows, there are many different flavors. Personally I don't like the "light" yogurt. I think the original is just as good. Maybe it's not as healthy, or maybe it is. But it feels better on my body and that's what matters to me.

So my challenge for you is try this out. Next time you crave a sweet treat, find a replacement for it. Make a change. Be better, be happy, be healthy, and enjoy it, but don't swim in it. Do what works for you.
It's a challenge to consider. If you do happen to make a change like I did, tell me about it! Post a comment because I would love to hear how you are changing to be and feel healthy.

P.S. This does not replace my decadent deliciousness. Every once in a while, a hunken piece of cheesecake or a bowl of ice cream is definitely in store. Just not every day.

Tuesday, February 4, 2014

Elementary Math post two: Probability Pains

If you're old, or even if you're not, do you remember ever watching the game shows where there are three doors, and behind one of the doors is a prize? Did you know there is a mathematical solution on how to win the prize? Well this game is called the Monty Hall Problem. Watch this video and you can see what I'm talking about.

To recap: you start out with three doors. You pick one door. The Game Show host then opens a different door that has a false prize behind the door, and now the question is, do you switch to the other door, or stay with the door you chose first? Most people would say that the chances are fifty-fifty and it makes no difference to switch or not. According to Ron Clarke, this is not correct. He says it is simple to understand why, but this is where my brain fell out of my head...

You should always swap doors, he says. This gives the contestant twice the chance of winning the prize. Why? Because to start with, the probability of getting the prize is 1/3 or 33%. The probability of getting a false prize is 2/3 or 66%. The chance that you have already picked the prize is 33%, and the chance you have picked the false prize is 66%. So why not swap? The chances of picking a false prize the first time is 66%. When the Host opens a false prize door, if you started out picking the false prize then you will for sure get the real prize if you swap. So if you switch, you then have a 33% chance of getting the fake prize after picking the car first and a 66% chance of getting the real prize after picking a false prize.

Dose that even make sense? I'm sure the video makes more sense then my recap, but maybe watch it again. Look above at what I wrote in italics. That is the key to this problem. I understand the explanation and how it could make sense, but if I sit and think on it my brain hurts! How do they come up with these numbers? Crazy math people, they are. So if you are ever on a game show, switch doors on your second chance. As luck would have it, you won't get the car. As chance would have it, you will get the car. The choice is yours.

Look what I found!

Thursday, January 16, 2014

Elementary Math post one: Goldfish!

The following is an assignment we did in class with a partner based on colored goldfish. The answer we gave to each question is in bold.

  • Number of healthy fish (not green): 37
  • Number of sick fish (green): 10
  • Total number of fish: 47
  • Compute the probability that a fish in your sample is healthy. 34/47
  • Compute the probability that a fish in your sample is sick. 10/47
  • Add together the probability of getting a sick fish plus the probability of getting a healthy fish. 1
  • Compute the probability of not getting a healthy fish. 10/47
  • Compute the probability of not getting a sick fish. 37/47
A park ranger estimates there are a total of three hundred fish in his pond. Using our numbers...
  • Estimate the number of healthy fish in the pond. 237
  • Estimate the number of sick fish in the pond. 63
If I wanted to catch and eat a fish out of the pond, how many fish must I catch to guarantee (100%) that I would catch at least 1 healthy fish? 64 fish

So what was the point of this activity? To be introduced into probability with a hands-on concept. As our first activity and lesson in the class, I really enjoyed it, even though I hate probability. 
When I first thought of probability, I thought of it mathematically looking like this (37:47) 
That example, however, is how odds are written. I might explain that in a later post. For now, I want to tell you what we learned.

We talked about probability. What does that mean? There are two different types of probability: experimental and theoretical. Experimental probability is what we did: we experimented with the outcomes and possible events. Theoretical probability is, in theory, how the outcome will turn out under ideal conditions. 
According to Bernoulli's Theorem, the more times an experiment is repeated, the closer the experimental probability comes to reaching the theoretical probability. That is why when doing an experiment, it is best to use large numbers or repeat the event many times to get the best results.

Well that's a wrap. It was brief and not very in depth, but if you look over our results from the fish activity then you should be able to put all of the pieces together. 

Check this out!